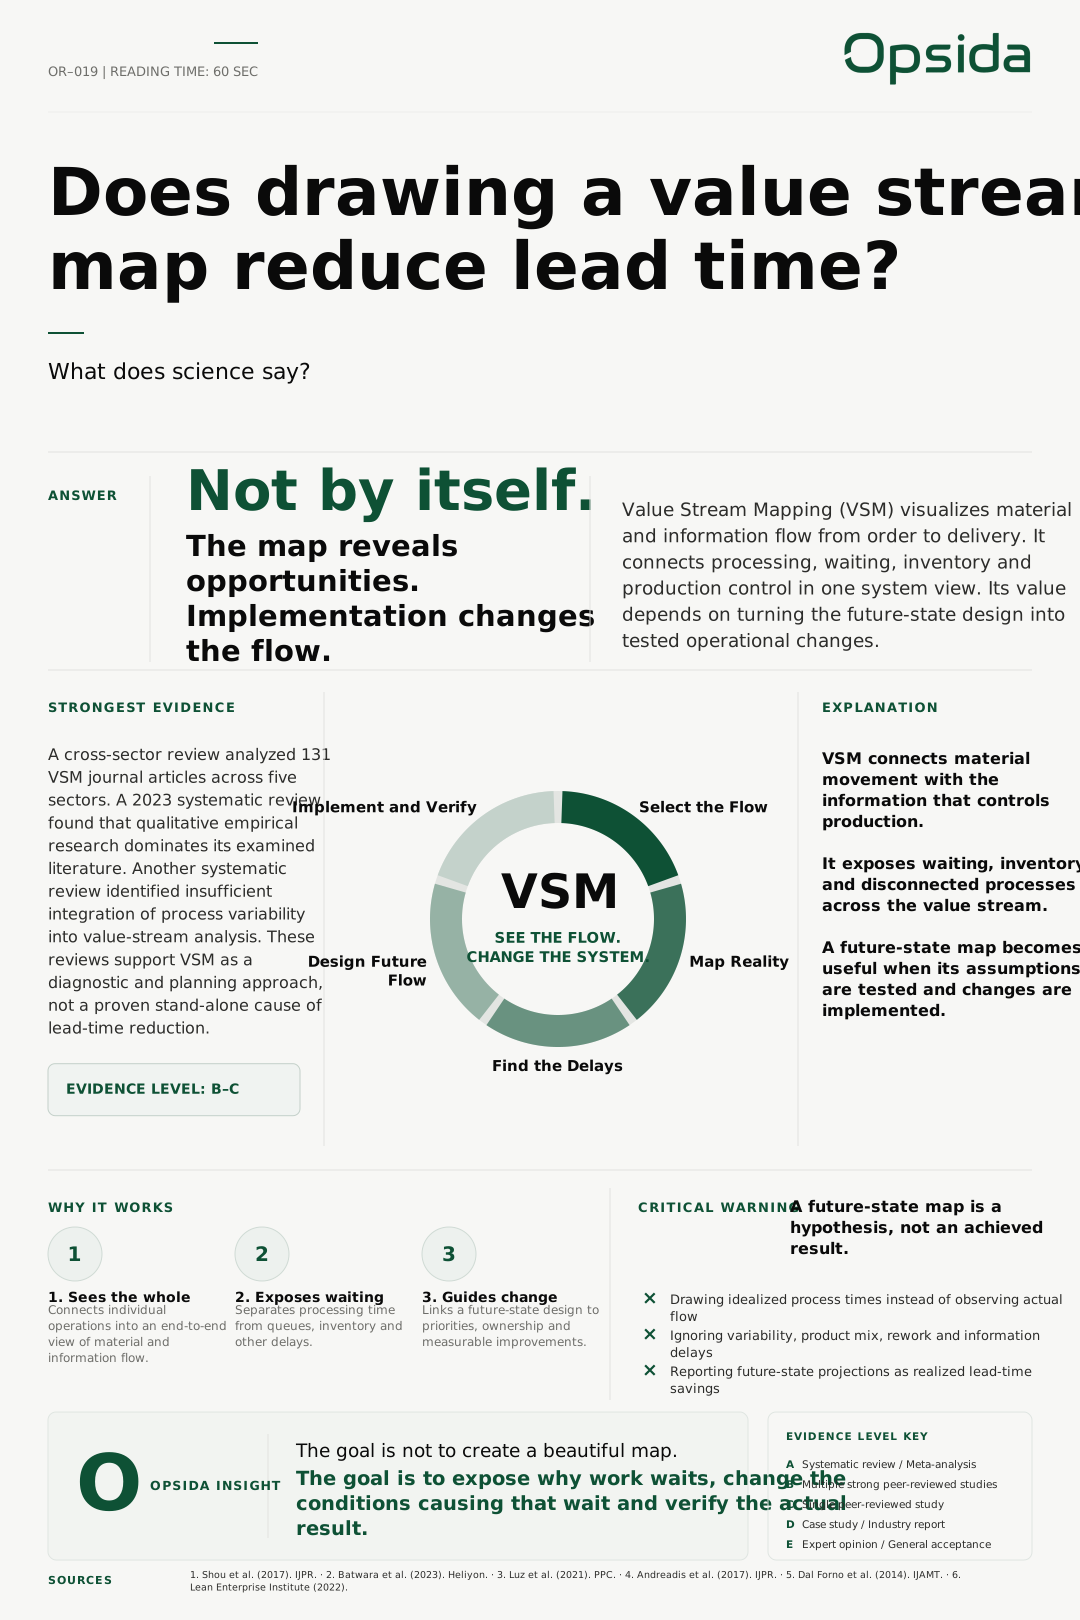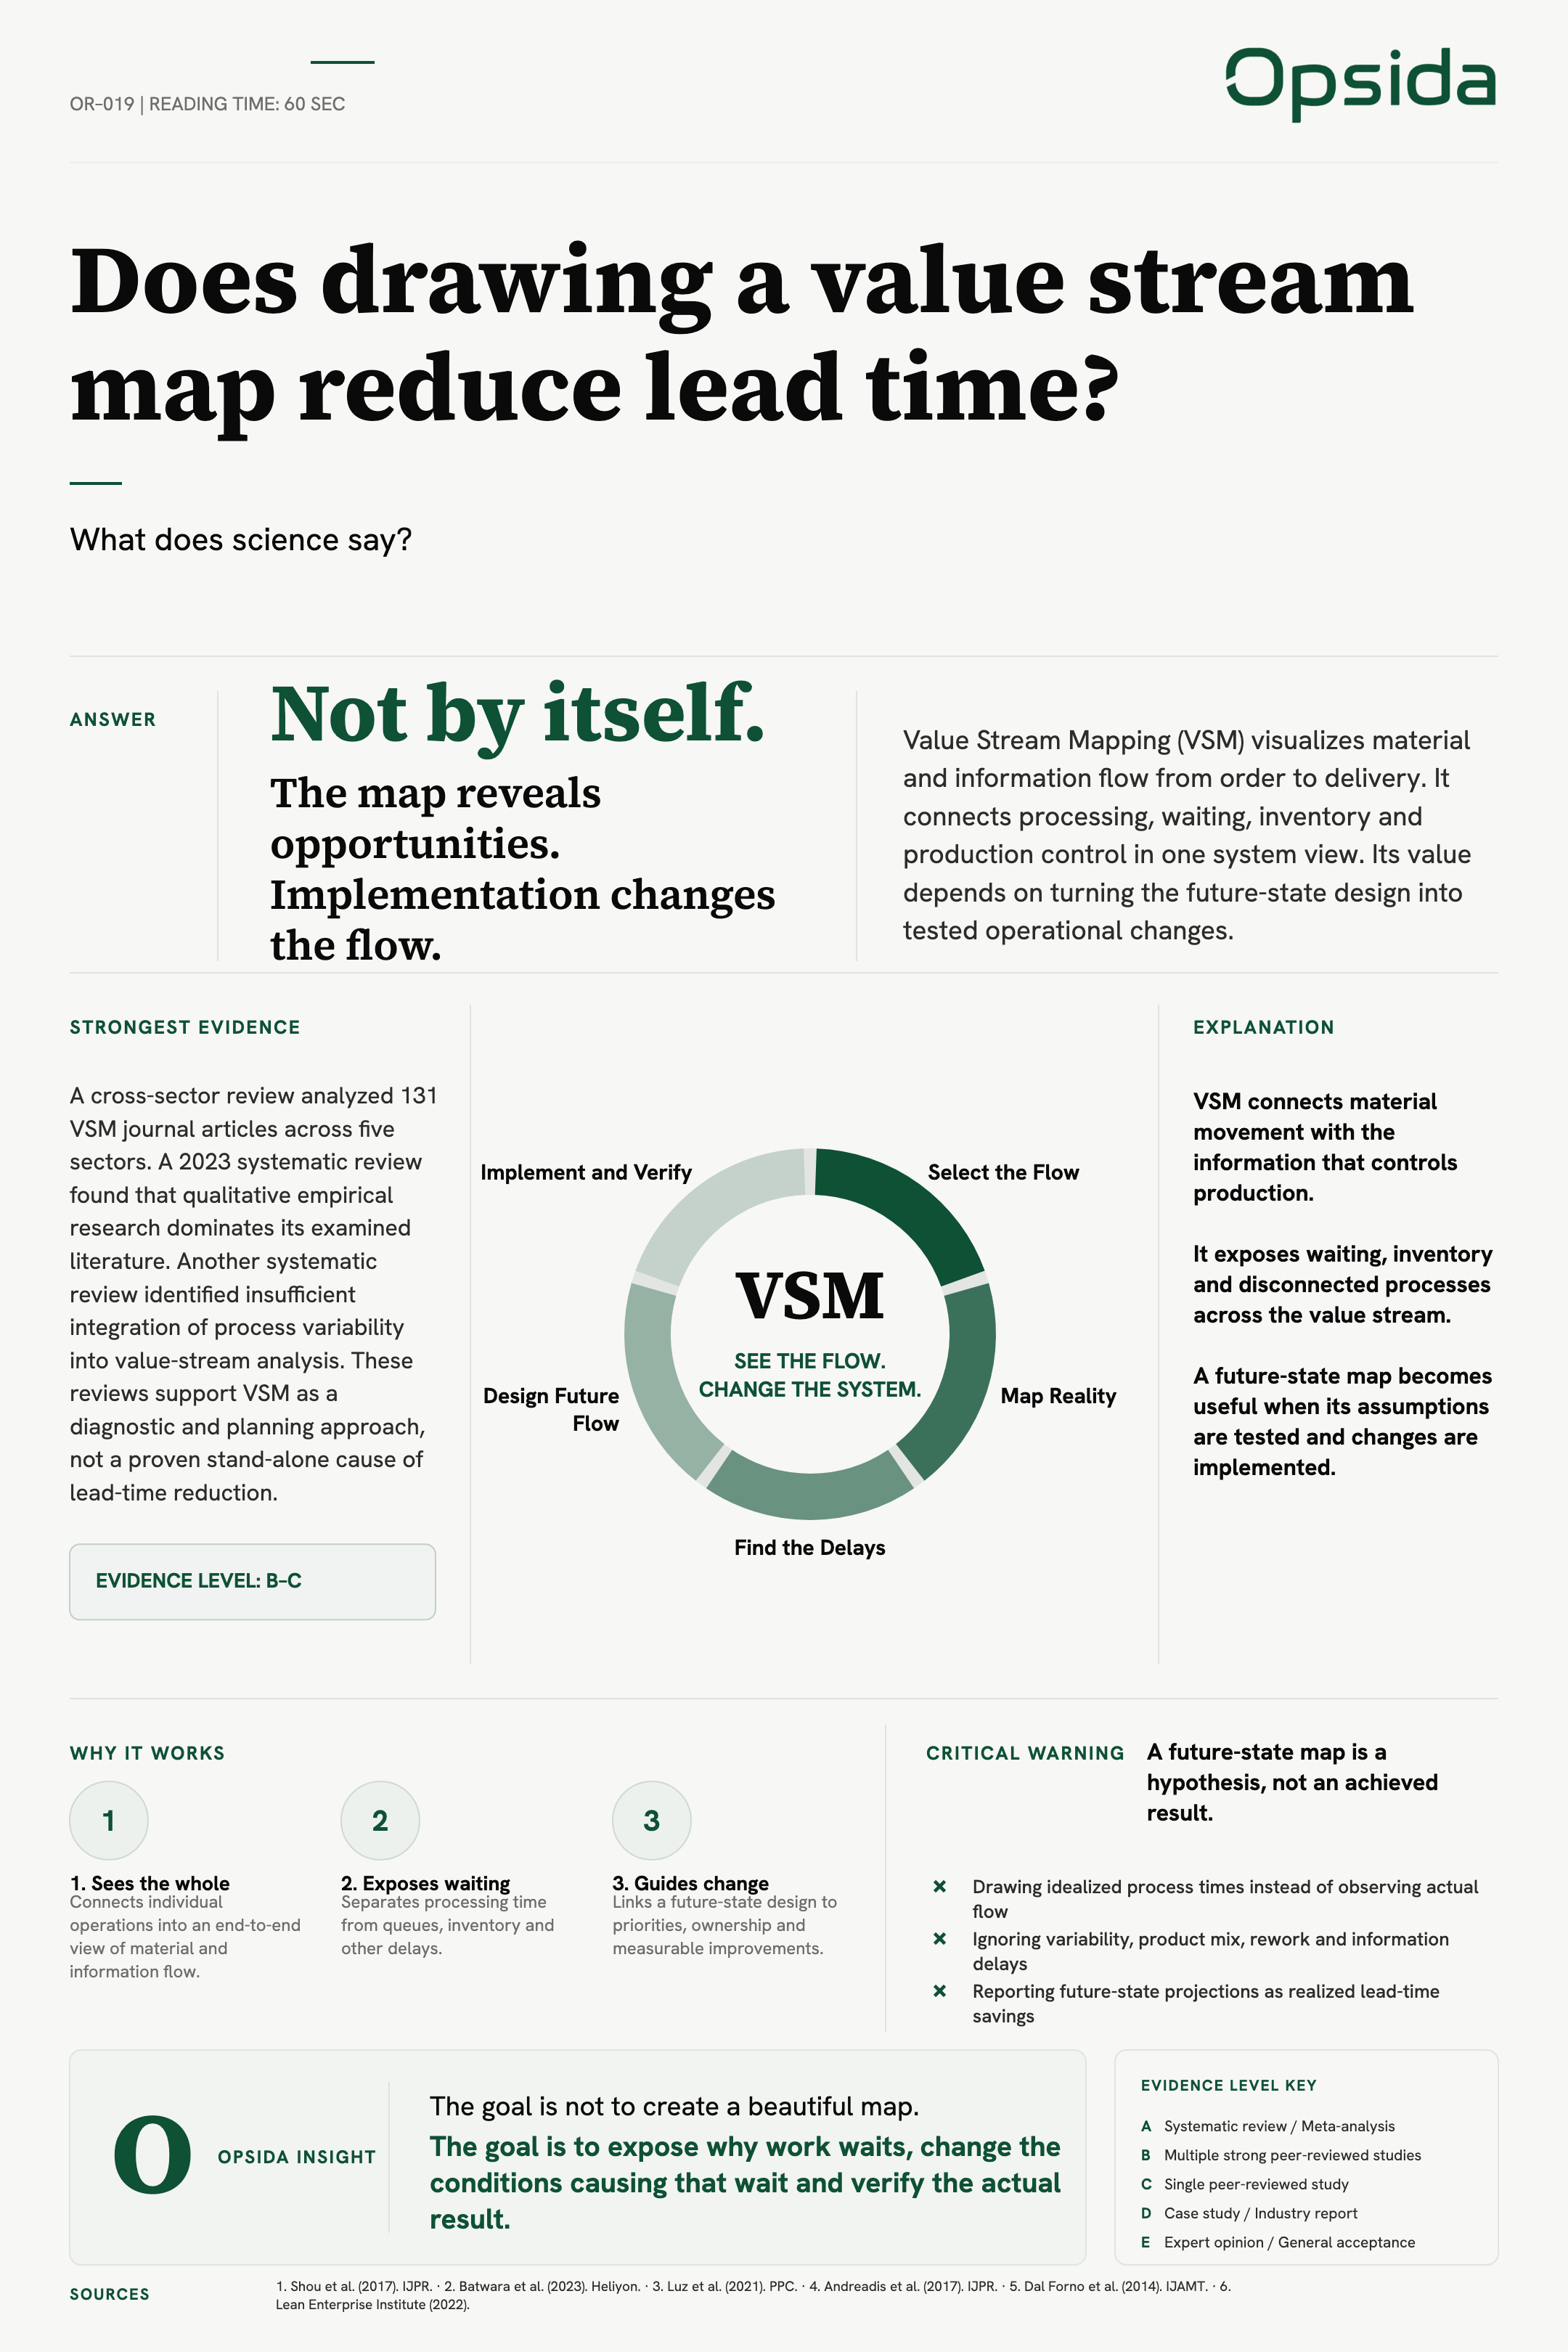
Does drawing a value stream map reduce lead time?
What does science say?
Answer
Not by itself.
The map reveals opportunities. Implementation changes the flow.
Value Stream Mapping (VSM) visualizes material and information flow from order to delivery. It connects processing, waiting, inventory and production control in one system view. Its value depends on turning the future-state design into tested operational changes.
Strongest evidence
A cross-sector review analyzed 131 VSM journal articles across five sectors. A 2023 systematic review found that qualitative empirical research dominates its examined literature. Another systematic review identified insufficient integration of process variability into value-stream analysis. These reviews support VSM as a diagnostic and planning approach, not a proven stand-alone cause of lead-time reduction.
131VSM journal articles reviewedFive sectors · 1999–2016 · cross-sector literature review · Literature corpus; not a manufacturing-only sample or effectiveness estimate
What it is made of
VSM see the flow. change the system.
- Select the Flow
- Map Reality
- Find the Delays
- Design Future Flow
- Implement and Verify
Explanation
- VSM connects material movement with the information that controls production.
- It exposes waiting, inventory and disconnected processes across the value stream.
- A future-state map becomes useful when its assumptions are tested and changes are implemented.
Why it works
Sees the whole
Connects individual operations into an end-to-end view of material and information flow.
Exposes waiting
Separates processing time from queues, inventory and other delays.
Guides change
Links a future-state design to priorities, ownership and measurable improvements.
Critical warning
A future-state map is a hypothesis, not an achieved result.
- Drawing idealized process times instead of observing actual flow
- Ignoring variability, product mix, rework and information delays
- Reporting future-state projections as realized lead-time savings
Opsida insight
The goal is not to create a beautiful map.
The goal is to expose why work waits, change the conditions causing that wait and verify the actual result.
Sources
Shou, W., Wang, J., Wu, P., Wang, X., & Chong, H.-Y. (2017). A cross-sector review on the use of value stream mapping. International Journal of Production Research, 55(13), 3906–3928.
Batwara, A., Sharma, V., Makkar, M., & Giallanza, A. (2023). Towards smart sustainable development through value stream mapping – a systematic literature review. Heliyon, 9(5), e15852.
Luz, G. P., Tortorella, G. L., Narayanamurthy, G., Gaiardelli, P., & Sawhney, R. (2021). A systematic literature review on the stochastic analysis of value streams. Production Planning & Control, 32(2), 121–131.
Andreadis, E., Garza-Reyes, J. A., & Kumar, V. (2017). Towards a conceptual framework for value stream mapping (VSM) implementation: an investigation of managerial factors. International Journal of Production Research, 55(23), 7073–7095.
Dal Forno, A. J., Pereira, F. A., Forcellini, F. A., & Kipper, L. M. (2014). Value Stream Mapping: a study about the problems and challenges found in the literature from the past 15 years about application of Lean tools. The International Journal of Advanced Manufacturing Technology, 72, 779–790.
Lean Enterprise Institute. (2022, August 25). Understanding the Fundamentals of Value-Stream Mapping.
Evidence level key
- A
- Systematic review / Meta-analysis
- B
- Multiple strong peer-reviewed studies
- C
- Single peer-reviewed study
- D
- Case study / Industry report
- E
- Expert opinion / General acceptance
Poster
The full issue as a single sheet — the same content, laid out for printing and sharing.