Does Visual Management really improve shop-floor performance?
What does science say?
Answer
It can.
When the visual makes the right condition obvious and triggers action.
Visual Management makes operational conditions easier to perceive, interpret and discuss. Its value depends on information relevance, visual design, team routines and whether abnormalities lead to problem solving.
Strongest evidence
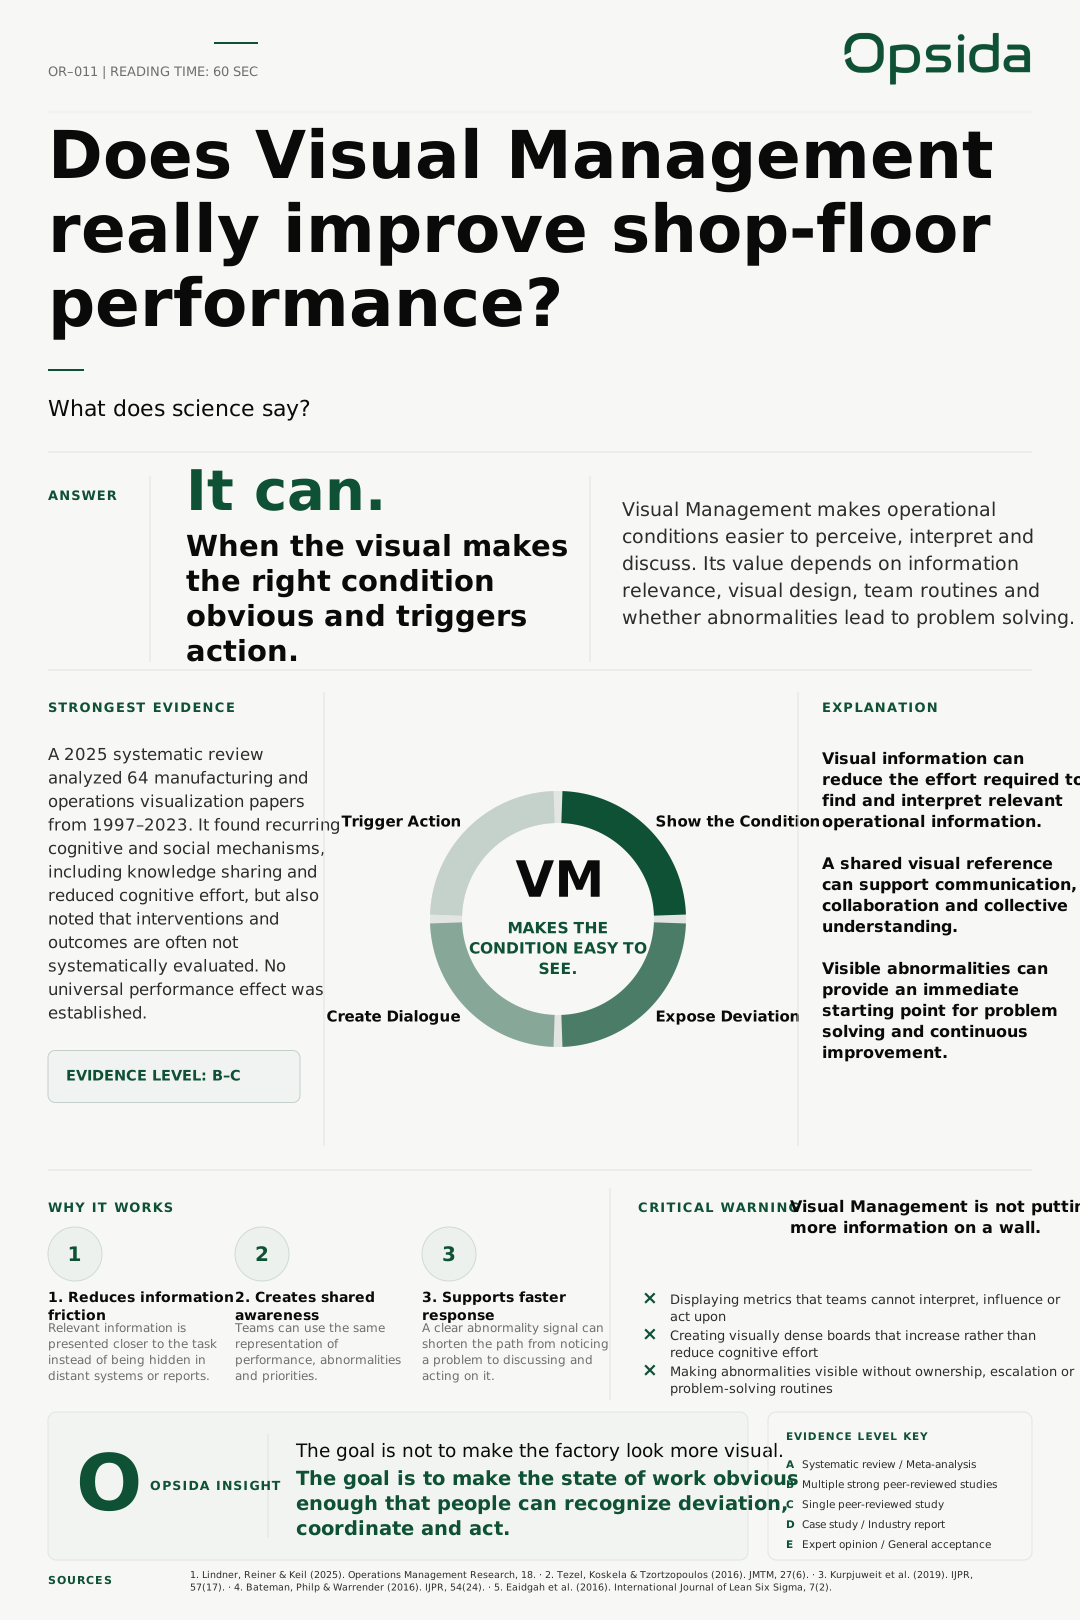
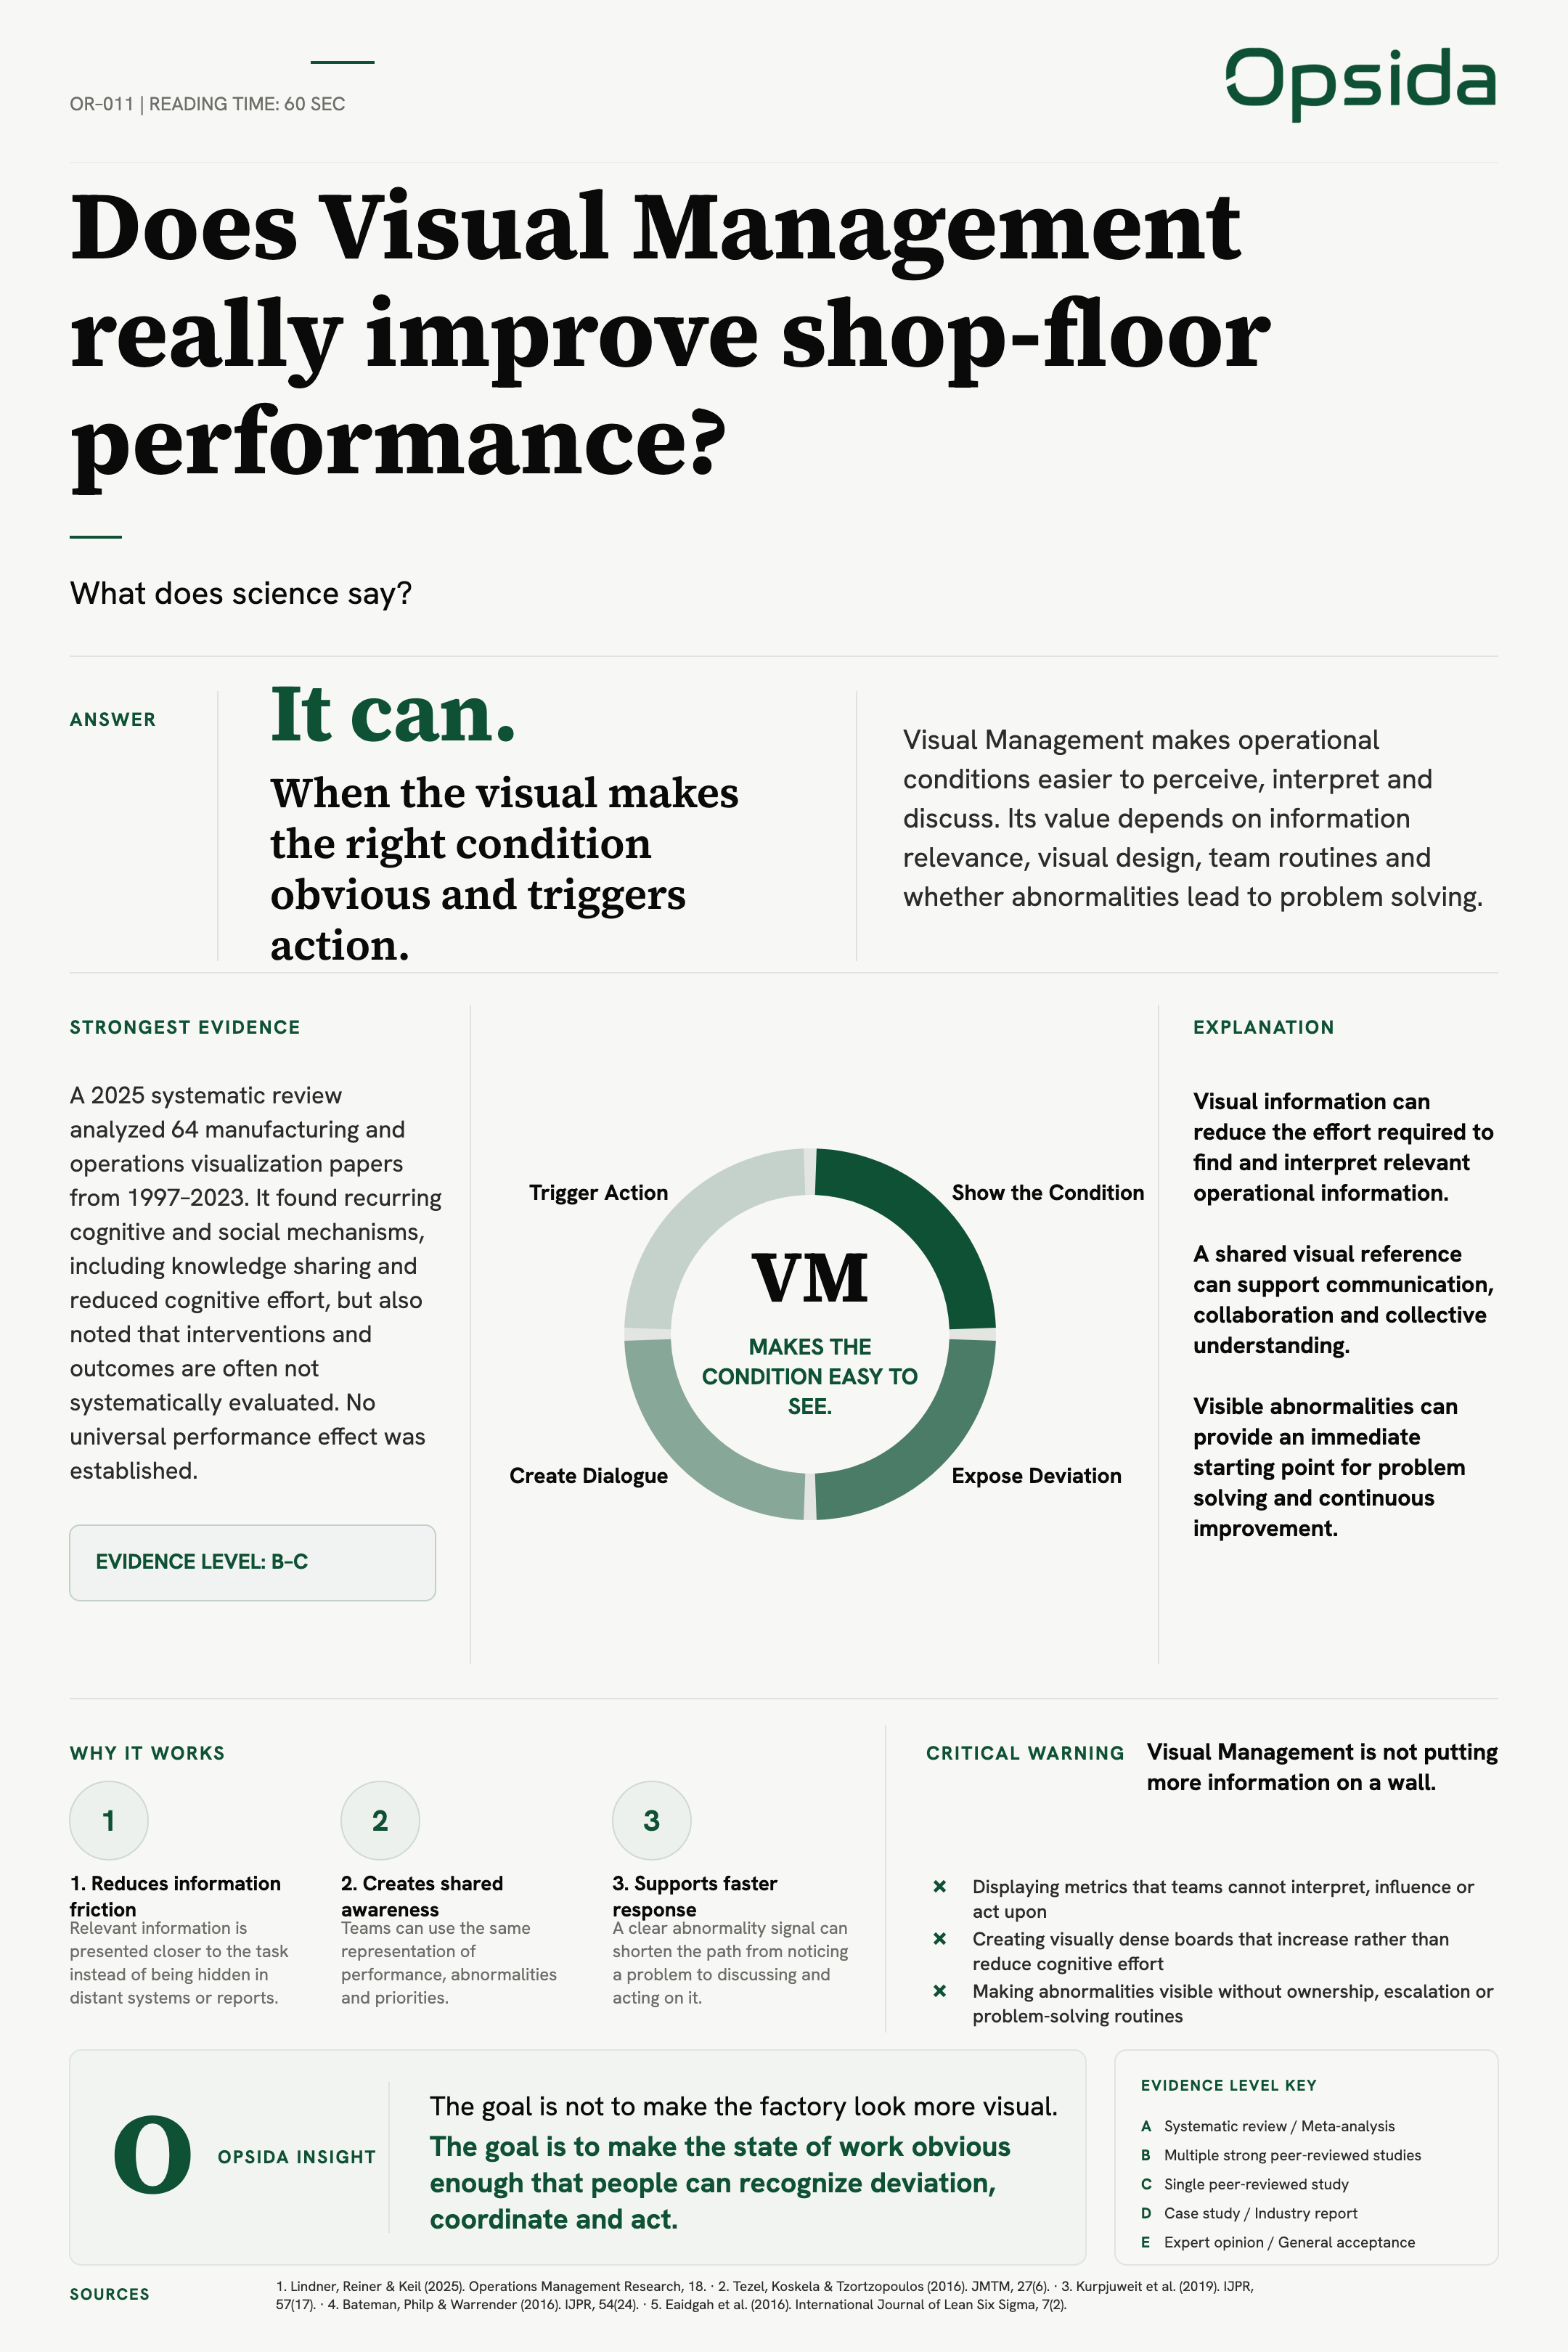
A 2025 systematic review analyzed 64 manufacturing and operations visualization papers from 1997–2023. It found recurring cognitive and social mechanisms, including knowledge sharing and reduced cognitive effort, but also noted that interventions and outcomes are often not systematically evaluated. No universal performance effect was established.
64manufacturing and operations visualization papers reviewed1997–2023 · systematic literature review published in 2025 · Broader manufacturing visualization literature; not an effectiveness sample
The steps, in order
VM makes the condition easy to see.
- Show the ConditionDisplay the information people need where and when the work is performed.
- Expose DeviationMake the difference between expected and actual conditions immediately recognizable.
- Create DialogueUse the visual as a shared reference for coordination and problem discussion.
- Trigger ActionConnect abnormalities to ownership, escalation and structured problem solving.
Explanation
- Visual information can reduce the effort required to find and interpret relevant operational information.
- A shared visual reference can support communication, collaboration and collective understanding.
- Visible abnormalities can provide an immediate starting point for problem solving and continuous improvement.
Why it works
Reduces information friction
Relevant information is presented closer to the task instead of being hidden in distant systems or reports.
Creates shared awareness
Teams can use the same representation of performance, abnormalities and priorities.
Supports faster response
A clear abnormality signal can shorten the path from noticing a problem to discussing and acting on it.
Critical warning
Visual Management is not putting more information on a wall.
- Displaying metrics that teams cannot interpret, influence or act upon
- Creating visually dense boards that increase rather than reduce cognitive effort
- Making abnormalities visible without ownership, escalation or problem-solving routines
Opsida insight
The goal is not to make the factory look more visual.
The goal is to make the state of work obvious enough that people can recognize deviation, coordinate and act.
Sources
Lindner, F., Reiner, G., & Keil, S. (2025). A behavioral perspective on visualization in manufacturing and operations management: A review, framework, and research agenda. Operations Management Research, 18, 317–352.
Tezel, A., Koskela, L., & Tzortzopoulos, P. (2016). Visual management in production management: A literature synthesis. Journal of Manufacturing Technology Management, 27(6), 766–799.
Kurpjuweit, S., Reinerth, D., Schmidt, C. G., & Wagner, S. M. (2019). Implementing visual management for continuous improvement: Barriers, success factors and best practices. International Journal of Production Research, 57(17), 5574–5588.
Bateman, N., Philp, L., & Warrender, H. (2016). Visual management and shop floor teams – development, implementation and use. International Journal of Production Research, 54(24), 7345–7358.
Eaidgah, Y., Maki, A. A., Kurczewski, K., & Abdekhodaee, A. (2016). Visual management, performance management and continuous improvement: A lean manufacturing approach. International Journal of Lean Six Sigma, 7(2), 187–210.
Evidence level key
- A
- Systematic review / Meta-analysis
- B
- Multiple strong peer-reviewed studies
- C
- Single peer-reviewed study
- D
- Case study / Industry report
- E
- Expert opinion / General acceptance
Poster
The full issue as a single sheet — the same content, laid out for printing and sharing.